mooda.WaterFrame()
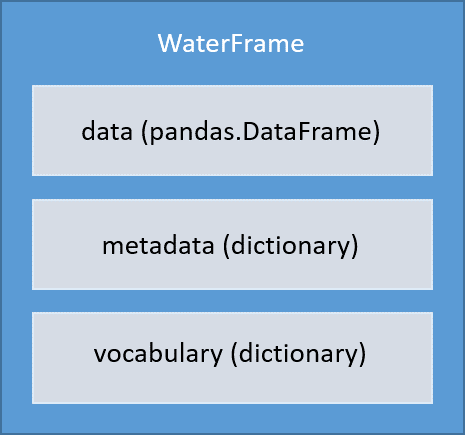
The WaterFrame object has been designed to contain all the information that can be obtained from a NetCDF file. WaterFrame relies on a pandas.DataFrame to save and manipulate data and two dictionaries to collect metadata.

The following describes the components of a WaterFrame:
- data: pandas.DataFrame where are the data to analyze or graph.
- metadata: Dictionary with all the related information to the data. Here the general attributes of a NetCDF file are saved.
- vocabulary: Here, the attributes of each variable are saved.
Magic methods
Constructor
It creates an empty pandas.DataFrame called WaterFrame.data and two dictionaries called WaterFrame.vocabulary and WaterFrame.metadata.
__repr__()
It returns a printable representational string of the WaterFrame with the following information:
- Consumption of memory of the WaterFrame
- Name of parameters
- Description of the parameters
- Units of the parameters
- Minimum value of each parameter
- Maximum value of each parameter
- Mean value of each parameter
Properties
WaterFrame.parameters
We call parameter to the key of the WaterFrame.data column containing “_QC”. For example, a WaterFrame.data that contains the keys: POSITION, TEMP, TEMP_QC, PSAL, PSAL_QC; the parameters are TEMP and PSAL.
Example
To reproduce the example, download the NetCDF file here and save it as example.nc in the same python script folder.
import mooda as md

path_netcdf = "example.nc"  # Path of the NetCDF file

wf = md.read_nc_emodnet(path_netcdf)
print(", ".join(wf.parameters))
Output:
DEPH, ATMS, CNDC, DRYT, PRES, PSAL, SVEL, TEMP, WDIR, WSPD
WaterFrame.memory_usage
It returns the memory usage of the WaterFrame in bytes.
To reproduce the example, download the NetCDF file here and save it as example.nc in the same python script folder.
import mooda as md

path_netcdf = "example.nc"  # Path of the NetCDF file

wf = md.read_nc_emodnet(path_netcdf)
print(f"{wf.memory_usage} bytes")
Output:
142484054 bytes
Methods
Data analysis
- WaterFrame.copy(): Get a copy of the WaterFrame.
- WaterFrame.corr(): Compute pairwise correlation of data columns of parameter1 and parameter2, excluding NA/null values.
- WaterFrame.drop(parameters, inplace=True): Remove input parameters from WaterFrame.data.
- WaterFrame.info_metadata(keys=None): It returns a formatted string with the metadata information.
- WaterFrame.info_vocabulary(keys=None): It returns a formatted string with the vocabulary information.
- WaterFrame.max_diff(parameter1, parameter2): It calculates the maximum difference between the values of two parameters.
- WaterFrame.max(parameter): Get the maximum value of a parameter.
- WaterFrame.min(parameter): Get the minimum value of a parameter.
- WaterFrame.rename(actual_name, new_name, inplace=True): It renames a parameter.
- WaterFrame.resample(rule, method=‘mean’, inplace=True): Convenience method for frequency conversion and sampling of time series of the WaterFrame object.
- WaterFrame.time_intervals(parameter, frequency): It returns the index (TIME) of intervals between NaNs.
- WaterFrame.use_only(parameters_to_use, inplace=True): It deletes all parameters except the input parameters.
- WaterFrame.reduce_memory(inplace=True): It reduces the WaterFrame size in memory by 30% - 50%
Output
- WaterFrame.metadata_to_html(): Make a html file with the metadata information.
- WaterFrame.to_csv(): Create a CSV file with the WaterFrame data.
- WaterFrame.to_es(): Injestion of the WaterFrame into a ElasticSeach DB.
- WaterFrame.to_json(): Get a JSON with the WaterFrame information.
- WaterFrame.to_nc(path, nc_format=“NETCDF4”): Save the WaterFrame into a NetCDF.
- WaterFrame.to_pkl(path): Save the WaterFrame in a Pickle file.
Static plot
- WaterFrame.plot_hist(parameters=None, mean_line=False, **kwds): Make a histogram of the WaterFrame’s. A histogram is a representation of the distribution of data.
- WaterFrame.plot_timebar(keys, ax=None, time_interval_mean=None): Make a bar plot of the input keys. The bars are positioned at x with date/time. Their dimensions are given by height.
- WaterFrame.plot_timeseries(parameters_to_plot=None, qc_flags=None, rolling_window=None, ax=None, average_time=None, secondary_y=None, color=None): Plot the input parameters with time on X and the parameters on Y. It calculates the standar deviation of a rolling window and plot it.
- WaterFrame.plot(**kwds): It calls the pandas DataFrame.plot() method.
Interactive plot
- WaterFrame.iplot_location(): It creates a Plotly Figure with a map and a spot of the measurement location of the WaterFrame.
- WaterFrame.iplot_timeseries(parameters_to_plot=None): It creates a Plotly figure with the time-series of the input parameters.
- WaterFrame.iplot_scatter(y, x=‘TIME’, trendline=None, marginal_x=None, marginal_y=‘histogram’, color=‘auto’, symbol=‘DEPTH’, range_y=‘auto’, **kwds): It makes an interactive scatter plot.
- WaterFrame.iplot_data_intervals(resample_rule=‘D’, **kwds): It creates a plot to view the time intervals of the parameters.
- WaterFrame.iplot_line(y, x=‘TIME’, marginal_x=None, marginal_y=‘histogram’, color=‘auto’, range_y=‘auto’, line_shape=‘lineard’, rangeslider_visible=True, line_group=‘DEPTH’, **kwds): Each data point is represented as a marker point, whose location is given by the x and y columns of self.data.
- WaterFrame.iplot_bar_polar(theta, color, r=‘auto’, template=‘xgridoff’, color_continuous_scale=‘auto’, **kwds): In a polar bar plot, each row of ‘color’ is represented as a wedge mark in polar coordinates.
Data Quality Control
- WaterFrame.qc_syntax_test(): It checks whether the object data contains all the QC columns required to pass the rest of the tests.
- WaterFrame.qc_flat_test(parameters=None, window=3, flag=4, inplace=True): It detects if there are equal consecutive values in the time series.
- WaterFrame.qc_range_test(parameters=None, limits=None, flag=4, inplace=True): Check if the values of a parameter are out of range.
- WaterFrame.qc_spike_test(parameters=None, window=0, threshold=3, flag=4, inplace=True): It checks if there is any spike in the time series.
Return to API reference.