wf.iplot_data_intervals(resample_rule=‘D’, **kwds)
Reference
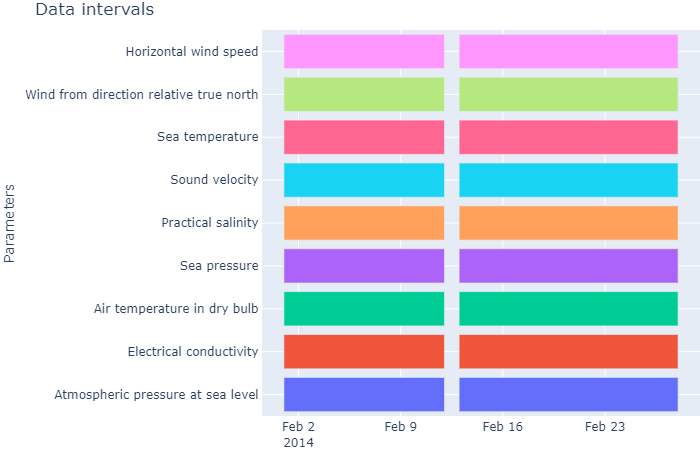
It uses plotly.express.timeline. It creates a plot to view the time intervals of the parameters.
Parameters
- resample_rule: Resample rule. (None, str)
- **kwds: Arguments from plotly.express.timeline
Returns
- figure: Dictionary of Plotly figure. (dict)
Example
To reproduce the example, download the NetCDF file MO_TS_MO_OBSEA_201401.nc.
import mooda as md

wf = md.read_nc_emodnet("MO_TS_MO_OBSEA_201402.nc")

fig = wf.iplot_data_intervals()
fig.show()
Output:
The output of this script is an interactive graph that cannot be displayed on the GitHub environment. To get the interactive chart, download and run this script on your computer. Below you will find the chart exported to png.

Return to mooda.WaterFrame.