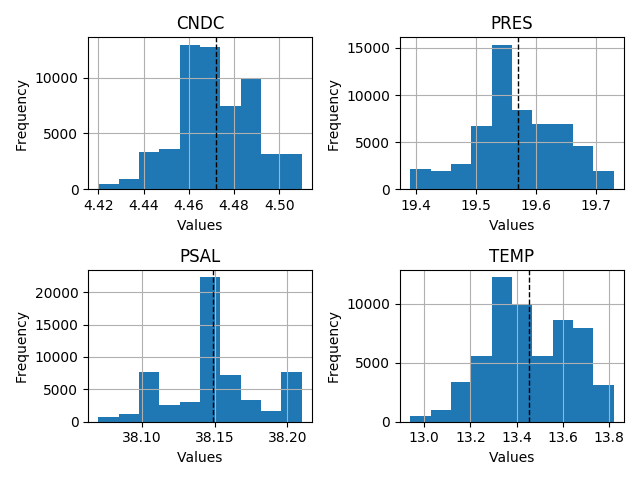
WaterFrame.plot_hist(parameters=None, mean_line=False, **kwds)
Reference
Make a histogram of the WaterFrame’s. A histogram is a representation of the distribution of data.
This function calls pandas.DataFrame.hist(), on each parameter of the WaterFrame, resulting in one histogram per parameter.
Parameters
- parameters: keys of self.data to be plotted. If parameters=None, it plots all parameters. (str, list of str)
- mean_line: It draws a line representing the average of the values. (bool)
- **kwds: All other plotting keyword arguments to be passed to DataFrame.hist().
Returns
- ax: Axes of the plot. (matplotlib.AxesSubplot)
Example
To reproduce the example, download the NetCDF file here and save it as example.nc in the same python script folder.
import mooda as md
import matplotlib.pyplot as plt

path_netcdf = "example.nc"  # Path of the NetCDF file

wf = md.read_nc_emodnet(path_netcdf)

wf.plot_hist(parameters=['TEMP', 'PSAL', 'CNDC', 'PRES'], mean_line=True)

plt.tight_layout()
plt.show()
Output:

Return to mooda.WaterFrame.