wf.plot_timebar(keys, ax=None, time_interval_mean=None)
Reference
Make a bar plot of the input keys. The bars are positioned at x with date/time. Their dimensions are given by height.
Parameters
- keys: Keys of self.data to plot. (list of str)
- ax: It is used to add the plot to an input axes object. (matplotlib.axes)
- time_interval_mean: It calculates an average value of a time interval. You can find all of the resample options here.
Returns
- ax: Axes of the plot. (matplotlib.AxesSubplot)
Example
To reproduce the example, download the NetCDF file here and save it as example.nc in the same python script folder.
import mooda as md
import matplotlib.pyplot as plt
path_netcdf = "example.nc" # Path of the NetCDF file
wf = md.read_nc_emodnet(path_netcdf)
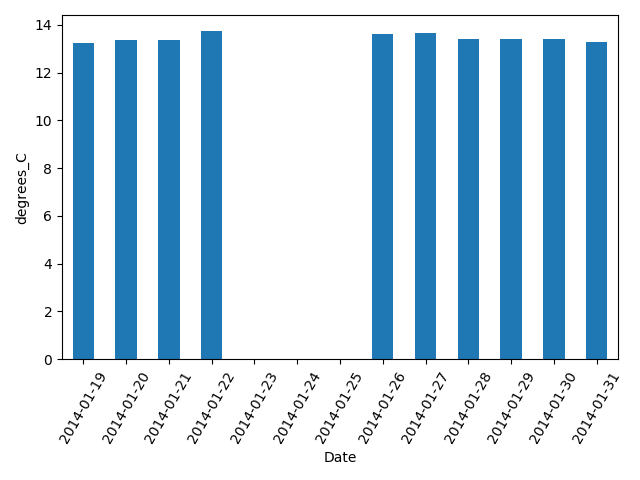
wf.plot_timebar('TEMP', time_interval_mean='D')
plt.show()
Output:
Return to mooda.WaterFrame.