Applying QARTOD QC tests to Water Temperature dataset
Following the QARTOD manual for T&S data, five QC tests are listed as “required”, three as “strongly recommended”, and five as “suggested”. Here below the details for all these tests.
Required tests
- Timing/Gap Test: Check for arrival data.
- Syntax Test: Expected data sentence received absence of parity errors
- Location test: Check for acceptable geographic location
- Gross Range Test: Data point exceeds sensor or operator selected min/max
- Climatology Test: Test that data point falls within seasonal expectations
Strongly recommended tests
- Spike Test: Data point n-1 exceeds a selected threshold relative to adjacent data points
- Rate of Change Test: Excessive rise/fall test
- Flat Line Test: Invariant value
Suggested tests
- Multi-Variate Test: Comparison to other variables
- Attenuated Signal Test: Inadequate variation test
- Neighbor Test: Comparison to nearby sensors of the same variable
- TS Curve/Space Test: Comparison to expected TS relationship
- Density Inversion Test: Checks that density increases with pressure (depth)
MOODA contains functionalities to perform some of the tests proposed by QARTOD. The QC tests implemented in MOODA are as follows:
- Syntax test: We can complete the 1st of the QARTOD tests. It checks whether the object data contains all the QC columns required to pass the rest of the tests. Note: This function is not yet implemented in the current “release” version. To use it, you need to use MOODA with the source code.
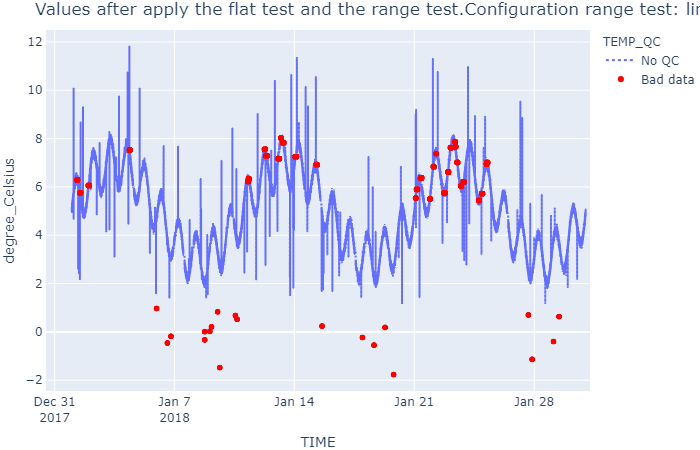
- Range test: Flag out-of-range values. With the range test, we can perform the 1st, 4th and 5th of the QARTOD tests. The QARTOD test 3 is also a range test on the position data. The sample dataset does not contain position columns so this test is not applicable.
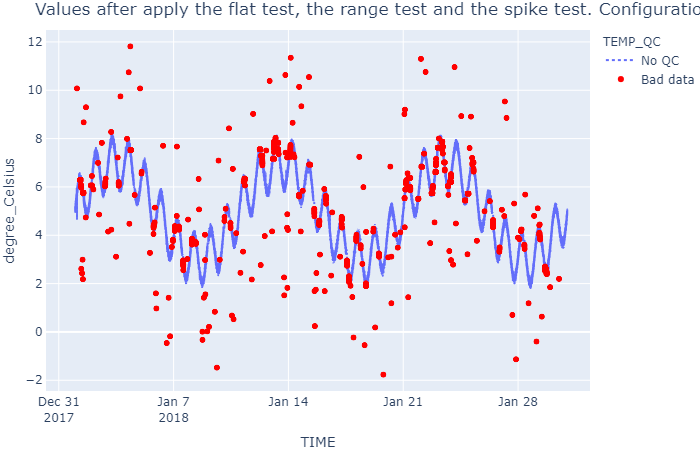
- Spike test: We can complete the 6th of the QARTOD tests. The QARTOD test 7 could be understood as a spike test with a lower threshold.
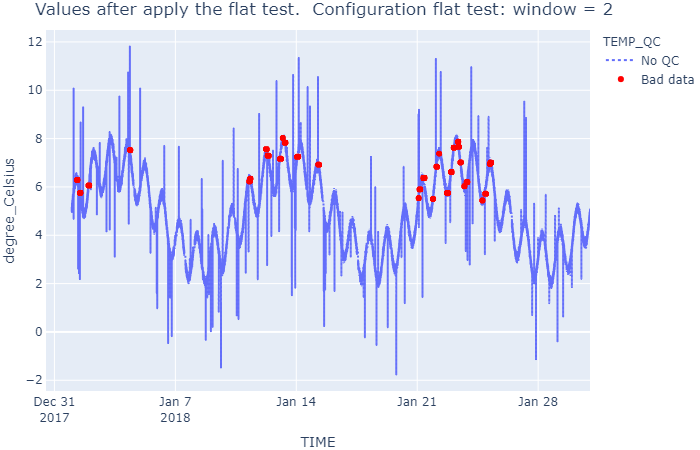
- Flat test: We can perform the 8th of the QARTOD tests.
QARTOD test number 9, 10, 11, 12 and 13 need to be developed with MOODA.
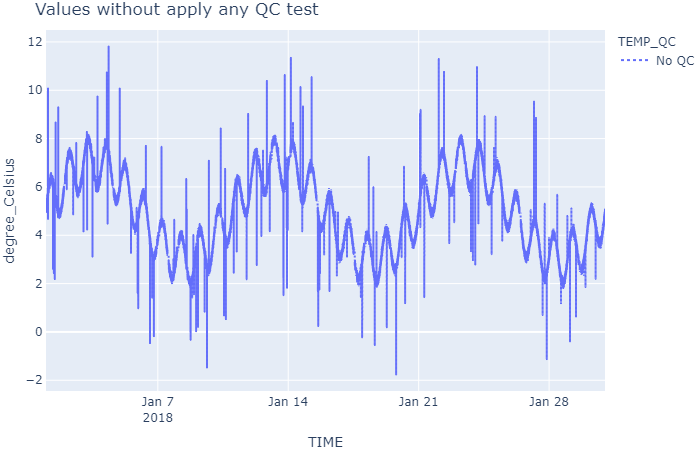
The following script uses the test_qc.pkl dataset, generated with the example Create a waterframe with fake data to evaluate the Quality Control Tests. The dataset contains water temperature values (TEMP parameter) and has not yet passed any quality control tests, so all indicators are at 0 (all TEMP_QC values are 0).
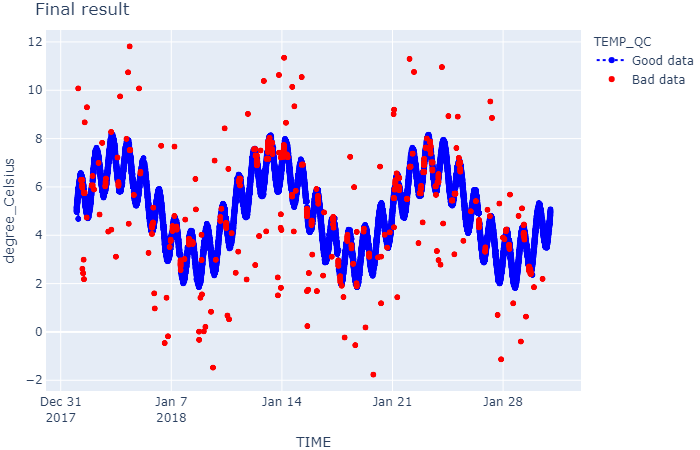
The script will flag the values without QC with a 0, values that have passed OK the tests correctly with a 1, and values that have passed KO the test with a 4.
Note that MOODA QC test only flags values that have not passed the test, leaving the “good values” with the original indicator. For this reason, it is recommended that initially all QC values be at 0, make the tests, and finally use the WaterFrame.replace() method to replace values that are still at 0, to 1.
The script first declares some configuration variables for the tests and then defines the function show_results(), which creates the graphs to analyze the results. Subsequently, the main code begins, where the dataset is opened, and QC tests are performed.
import mooda as md

# Configuration variables
dataset_location = r'.\docs\examples\data\test_qc.pkl'
# QC tests
## Flat test
window_flat = 2
## Range test
limits = [1, 40]
## Spike test
window_spike = 100
threshold = 3.5
influence = 0.5

def show_result(wf, chart_title=''):
    # Change name of flags
    wf2 = wf.copy()
    qc_labels = {0: 'No QC', 1: 'Good data', 4: 'Bad data'}
    wf2.data['TEMP_QC'].replace(qc_labels, inplace=True)

    fig = wf2.iplot_line(
        'TEMP',
        color='TEMP_QC',
        marginal_y=None,
        line_shape='linear',
        rangeslider_visible=False,
        line_dash_sequence=['dot', 'dot'],
        title=chart_title)
    fig.show()

# Main code

## Open file
wf = md.read_pkl(dataset_location)
show_result(wf, 'Values without apply any QC test')

## QC tests
### Syntax test. This function is not yet implemented in the current "release" version. To use it, you need to use MOODA with the source code.
ok = wf.qc_syntax_test()
if ok:
    print('The syntaxis of the data is correct')
else:
    print('The syntaxis of the data is not correct')
### Flat test
wf.qc_flat_test()
show_result(
    wf, 'Values after apply the flat test. ' + \
        f' Configuration flat test: window = {window_flat}')
### Range test
wf.qc_range_test(limits=limits)
show_result(
    wf, 'Values after apply the flat test and the range test.' + \
        f'Configuration range test: limits = {limits}')
### Spike test
wf.qc_spike_test(window=window_spike, influence=influence, threshold=threshold)
show_result(
    wf, 'Values after apply the flat test, the range test and the spike test.' + \
        f' Configuration spike test: window = {window_spike}, influence = {influence}, ' + \
        f'threshold = {threshold}')
## It replaces the QC values that are still 0, to 1
wf.qc_replace()
show_result(wf, f'Final result')
Output:
The syntaxis of the data is correct
Return to the Index of examples.