Make a WaterFrame with fake data to evaluate the Quality Control Tests
The goal of this example is to create a WaterFrame object that contains data that follows a clear trend, but with point-in-time errors. This dataset is intended to test the QC algorithms and check their operation.
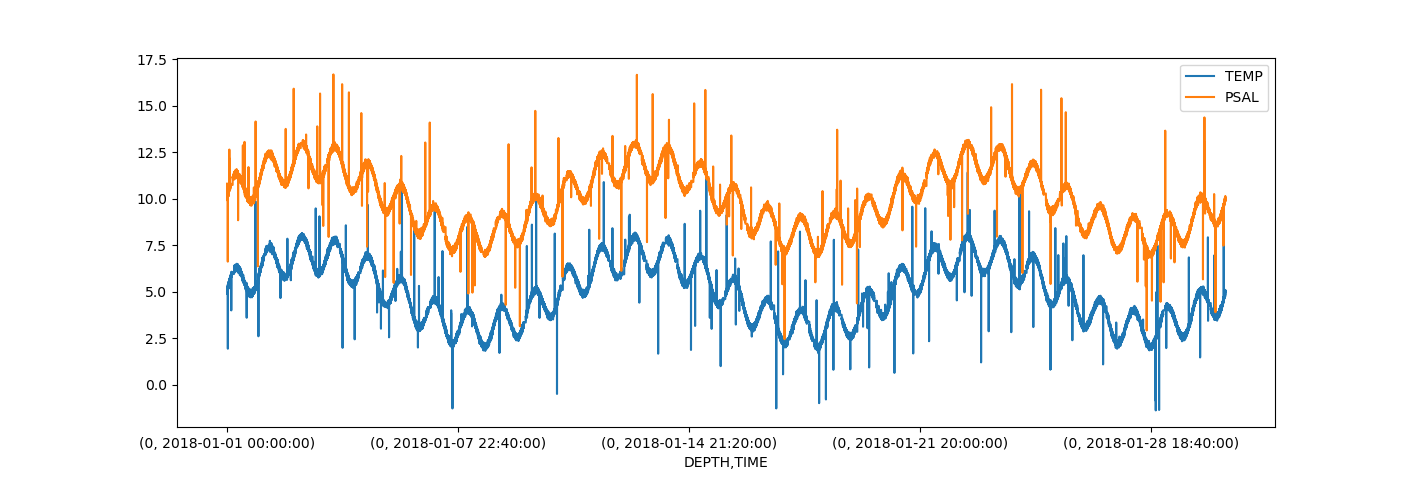
The script will first generate the WaterFrame object, simulating water temperature and salinity data with a sine signal. Point-in-time errors will then be added to the data. Finally, the result will be displayed, creating a chart.
Optionally, you can create a Pickle, NetCDF, or CSV file to later be opened in other scripts.
import mooda as md
import pandas as pd
import numpy as np
import matplotlib.pyplot as plt

# Make the WaterFrame
wf = md.WaterFrame()

# Add some metadata
wf.metadata['title'] = 'Fake dataset to evaluate the Quality Control Tests'
wf.metadata['parameters'] = [
    'TEMP - Water Temperature [degree_Celsius]',
    'PSAL - Water Salinity [PSU]']

# Add vocabulary information
wf.vocabulary['TEMP'] = {
    'long_name': 'Water Temperature',
    'units': 'degree_Celsius'
}
wf.vocabulary['PSAL'] = {
    'long_name': 'Water Salinity',
    'units': 'PSU'
}


# Make data
## Make a pandas DataFrame with the dates and values
df = pd.DataFrame()

### Creation of the index values (TIME)
dates = pd.date_range(start='20180101', end='20180131', freq='T')
df['TIME'] = dates

### Add values of depth, all 0
df['DEPTH'] = 0

### Add QC parameters, all 0
df['DEPTH_QC'] = 0
df['TIME_QC'] = 0

### Creation of the values
num_samples = dates.size  # Get length of data array
x = np.arange(num_samples)  # Init the data array
freq = 30  # Frequency of the sinus signal
for parameter in ['TEMP', 'PSAL']:

    if parameter == 'TEMP':
        offset = 5  # Offset for the sinus values, write here any number
    elif parameter == 'PSAL':
        offset = 10  # Offset for the sinus values, write here any number

    values = [offset + np.sin(2*np.pi*freq * (i/num_samples)) for i in x]

    #### Add some noise to the values
    noise_factor = 12  # write here any number. The higher number, the less noise
    noise = np.random.randn(num_samples)/noise_factor
    values = values + noise

    #### Add a season trend
    freq_trend = 3  # write here any number
    power_factor = 2  # It modifies the peak to peak value, write here any number
    values_trend = [power_factor * np.sin(2*np.pi*freq_trend * (i/num_samples)) for i in x]
    values = values + values_trend


    #### Add error to values
    ##### Spikes
    spike_power = 1000  # Write here any number
    spike_provability = 0.005  # Number between 0 and 1, provability to make a spike
    spike_values = []
    for i in x:
        spike = np.random.randn()
        if abs(spike) < spike_provability:
            spike_values.append(spike_power*spike)
        else:
            spike_values.append(0)
    values = values + spike_values
    ##### Flat zones
    maximun_repetition = 100  # Write here any number
    flat_provability = 0.003  # Number between 0 and 1, provability to make a flat window
    i = 0
    while i < (len(values) - maximun_repetition):
        flat_number = np.random.randn()
        if abs(flat_number) < flat_provability:
            repetition = np.random.randint(0, maximun_repetition)
            for rep_count in range(repetition):
                values[i+1] = values[i]
                i += 1
        else:
            i += 1

    #### Add data to the WaterFrame
    df[parameter] = values
    df[f'{parameter}_QC'] = 0

### Set index
df.set_index(['DEPTH', 'TIME'], inplace=True)

## Add the pandas DataFrame to the WaterFrame object
wf.data = df.copy()

# Show result
wf.data[['TEMP', 'PSAL']].plot()
plt.show()
Output:

Optional:
# Save WaterFrame to pikle
wf.to_pkl('test_qc.pkl')
# Save WaterFrame to CSV
wf.to_csv('test_qc.csv')
# Save WaterFrame to NetCDF
wf.to_nc('test_qc.nc')
Return to the Index of examples.