Make a WaterFrame following the OceanSites specification
In this example, we are going to create a WaterFrame that contains all the Metadata and Vocabularies fields defined in the OceanSites v1.3 standard.
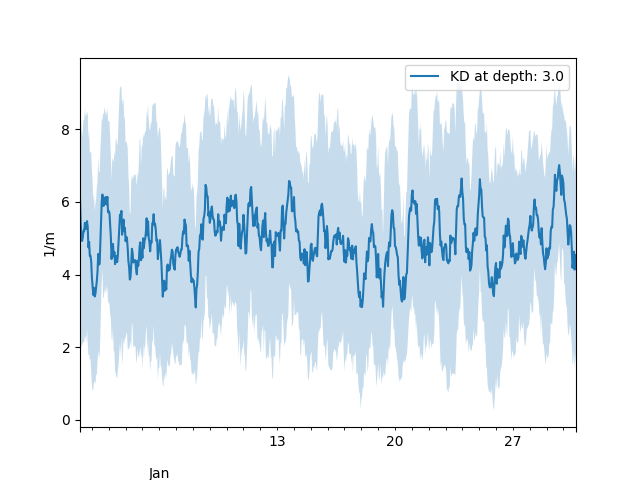
The WaterFrame will contain random values of the parameter “Diffuse attenuation coefficient” with an hourly frequency during the month of January 2020. The values of the metadata fields are just examples.
import pandas as pd
import numpy as np
import mooda as md

# Metadata definition
metadata = {
    # Discovery and identification
    'site_code': 'virtual-site-1',
    'platform_code': 'virtual-platform-1',
    'data_mode': 'D',  # Options on page 18 of the OceanSites document
    'title': 'test-data-1',
    'summary': 'This is a test WaterFrame.',
    'naming_authority': 'CSIC',
    # id = 'OS'_<platform_code>_<Year and month>_<data-type: P-profile TS-time-series T-trajectory>
    'id': 'OS_virtual-platform-1_202001_TS',
    # Use n/a or delete the field for not necessary metadata information.
    # Do not leave it void or with a space " ".
    'wmo_platform_code': 'n/a',
    'source': 'moored surface buoy',  # Options on page 7 of the OceanSites document
    'principal_investigator': 'Jon Doe',
    'principal_investigator_email': 'jdoe@utm.csic.es',
    'principal_investigator_url': 'http://jondoe.web',
    'institution': 'Marine Science Institut - CSIC',
    'project': 'MONOCLE',
    'array': 'n/a',
    'network': 'monocle',
    'keywords_vocabulary': 'CF',
    'keywords': 'Kd, timeseries, test data',
    'comment': 'Test data',
    # Geo-spatial-temporal
    'area': 'cloud',
    'geospatial_lat_min': 41.385359,
    'geospatial_lat_max': 41.385359,
    'geospatial_lat_units': 'degree_north',
    'geospatial_lon_min': 2.196320,
    'geospatial_lon_max': 2.196320,
    'geospatial_lon_units': 'degree_east',
    'geospatial_vertical_min': 0,
    'geospatial_vertical_max': 3,
    'geospatial_vertical_positive': 'down',
    'geospatial_vertical_units': 'meter',
    'time_coverage_start': '2020-01-01T00:00:00Z',
    'time_coverage_end': '2020-01-31T23:00:00Z',
    'time_coverage_duration': 'P1M',  # Info on page 8
    'time_coverage_resolution': 'PT1H',  # Info on page 8
    'cdm_data_type': 'Station',
    'featureType': 'timeSeries',
    'data_type': 'OceanSITES time-series data',  # Options on page 17
    # Conventions used
    'format_version': '1.3',
    'Conventions': 'CF-1.6, OceanSITES-1.3',
    # Publication information
    'publisher_name': 'Raul Bardaji',
    'publisher_email': 'bardaji@utm.csic.es',
    'publisher_url': 'https://www.linkedin.com/in/raul-bardaji-benach/',
    'references': 'http://www.oceansites.org',
    'data_assembly_center': 'Marine Science Institut - CSIC',
    'update_interval': 'n/a',
    'license': 'Creative Commons: Attribution-ShareAlike 4.0 International',
    'citation': 'These data were collected and made freely available by the MONOCLE project and ' \
        'the national programs that contribute to it.',
    'acknowledgement': 'MONOCLE and EMSO - Laboratorios Submarinos Profundos',
    # Provinance
    'data_created': '2020-04-07T08:09:00Z',
    'data_modified': '2020-04-07T08:09:00Z',
    'history': '2020-04-07T08:09:00Z metadata created, R. Bardaji.',
    'processing_level': 'Raw instrument data',  # pag. 18
    'QC_indicator': 'unknown',  # Options of pag. 10 CAUTION: THIS IS THE QC LABEL OF THE METADATA INFORMATION
    'contributor_name': 'Raul Bardaji; Carlos Rodero',
    'contributor_role': 'Editor and data maker; Verification',
    'contributor_email': 'bardaji@utm.csic.es; rodero@icm.csic.es'}

# Vocabulary definition
vocabulary = {
    'TIME': {
        'standard_name': 'time',
        'units': 'number of seconds that have elapsed since January 1, 1970 (midnight UTC/GMT)',
        'axis': 'T',
        'long_name': 'time of measurement',
        'valid_min': -9223372036854775808,
        'valid_max': 9223372036854775808,
        'QC_indicator': 'unknown',  # CAUTION: THIS IS THE QC LABEL OF THE TIME INFORMATION
        'processing_level': 'Raw instrument data',
        'uncertainty': 'nan',
        'comment': 'Time is going be visualized as YYYY/MM/DD hh:mm:ss'},
    'TIME_QC': {
        'long_name': 'quality flag for TIME',
        'flag_values': [0, 1, 2, 3, 4, 7, 8, 9],
        'flag_meanings': 'unknown good_data probably_good_data potentially_correctable_bad_data' \
            'bad_data nominal_value interpolated_value missing_value'},
    'DEPTH': {
        'standard_name': 'depth',
        'units': 'meters',
        'positive': 'down',
        'axis': 'Z',
        'reference': 'sea_level',
        'coordinate_reference_frame': 'urn:ogc:def:crs:EPSG::5831',
        'long_name': 'Depth of measurement',
        '_FillValue': 'nan',
        'valid_min': -10,
        'valid_max': 12000,
        'QC_indicator': 'unknown',  # CAUTION: THIS IS THE QC LABEL OF THE DEPTH INFORMATION
        'processing_level': 'Raw instrument data',
        'uncertainty': 'nan',
        'comment': 'Depth calculated from the sea surface'},
    'DEPTH_QC': {
        'long_name': 'quality flag for DEPTH',
        'flag_values': [0, 1, 2, 3, 4, 7, 8, 9],
        'flag_meanings': 'unknown good_data probably_good_data potentially_correctable_bad_data' \
            'bad_data nominal_value interpolated_value missing_value'},
    'KD': {
        'standard_name': 'downwelling_diffuse_attenuation_coefficient',
        'units': '1/m',
        '_FillValue': 'nan',
        'coordinates': 'TIME, DEPTH',
        'long_name': 'Downwelling Diffuse Attenuation Coefficient',
        'QC_indicator': 'unknown',  # CAUTION: THIS IS THE QC LABEL OF THE KD INFORMATION
        'processing_level': 'Raw instrument data',
        'valid_min': 0,
        'valid_max': 10,
        'comment': 'KD vocabulary is not standard.',
        'ancillary_variables': 'KD_QC',
        'history': '2020-04-07T08:47:00Z KD vocabulary created, R. Bardaji.',
        'uncertainty': 0,
        'accuracy': 1,
        'precision': 1,
        'resolution': 0.001,
        'cell_methods': 'TIME: mean DEPTH: max',
        'DM_indicator': 'D',  # page 18
        'reference_scale': 'KDS-2020',  # Not real scale
        'sensor_model': 'virtual kduino',
        'sensor_manufacturer': 'Marine Technology Unit - CSIC',
        'sensor_reference': 'https://github.com/rbardaji/mooda',
        'sensor_serial_number': '0001',
        'sensor_mount': 'mounted_on_surface_buoy',  # page 21
        'sensor_orientation': 'downward'},  # page 21
    'KD_QC': {
        'long_name': 'quality flag for KD',
        'flag_values': [0, 1, 2, 3, 4, 7, 8, 9],
        'flag_meanings': 'unknown good_data probably_good_data potentially_correctable_bad_data' \
            'bad_data nominal_value interpolated_value missing_value'}}


# Make data
# Make the TIME index
date_rng = pd.date_range(start='1/1/2020', end='31/01/2020', freq='h')
# Make a pandas.DataFrame with the values of TIME
data = pd.DataFrame(date_rng, columns=['TIME'])
# Add the other parameters
data['TIME_QC'] = 0
data['DEPTH'] = 3
data['DEPTH_QC'] = 0
# Random numbers between 0 and 10 with 3 decimals
data['KD'] = np.round(np.random.uniform(low=0, high=10, size=len(date_rng)), 3)
data['KD_QC'] = 0
# Set index to TIME and DEPTH
data.set_index(['TIME', 'DEPTH'], inplace=True)

# Make the WaterFrame
wf = md.WaterFrame()
wf.data = data
wf.metadata = metadata
wf.vocabulary = vocabulary
Optional, plot it!
import matplotlib.pyplot as plt

# Add the previous code here

wf.plot_timeseries()
plt.show()
Output:

Return to the Index of examples.