How to check data quality with a Widget for Jupyter Notebook
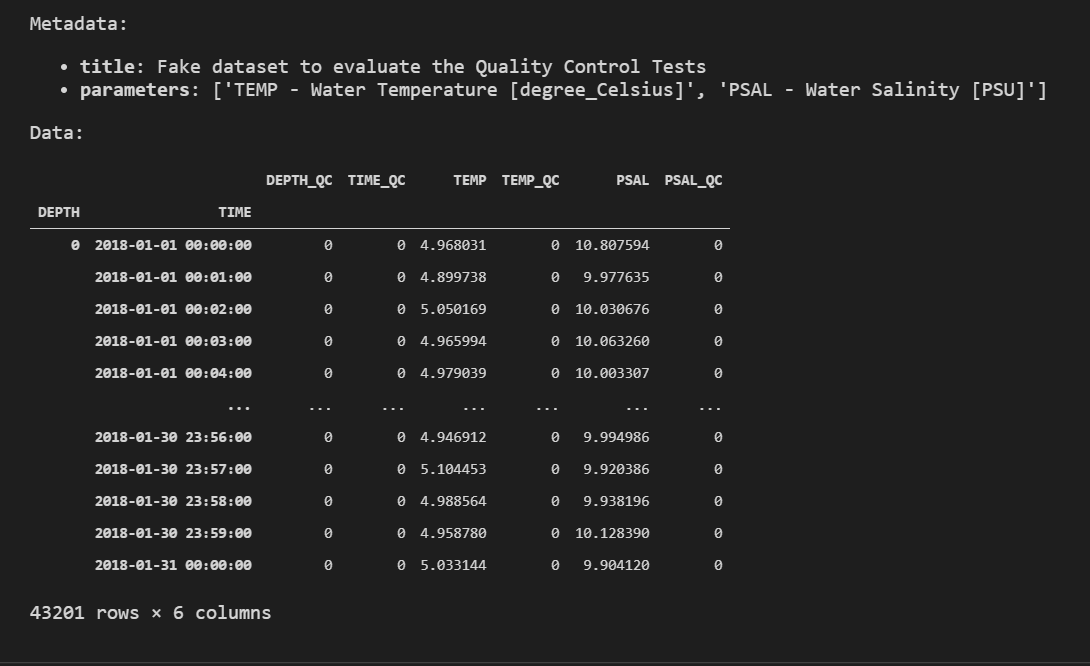
In this example, we will first read the dataset test_qc.pkl that contains water temperature data and then use a Jupyter Notebook widget to check the quality of the data and flag the incorrect data.
To run this example on your computer, you need to download the dataset.
import mooda as md

# Location of the dataset
path = r'docs\examples\data\test_qc.pkl'
# Read the dataset
wf = md.read_pkl(path)

wf

Open the widget, loading the WaterFrame with the parameter TEMP (Water Temperature)
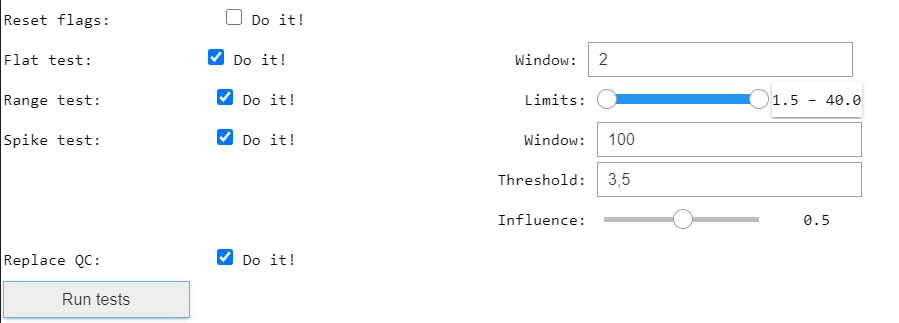
Then, check all test (click on ‘Do it!’) with the following configuration:
- Flat test -> Window: 2
- Range test -> Limits: 1.5, 40
- Spike test -> Window: 100
- Spike test -> Threshold: 3.5
- Spike test -> Influence: 0.5
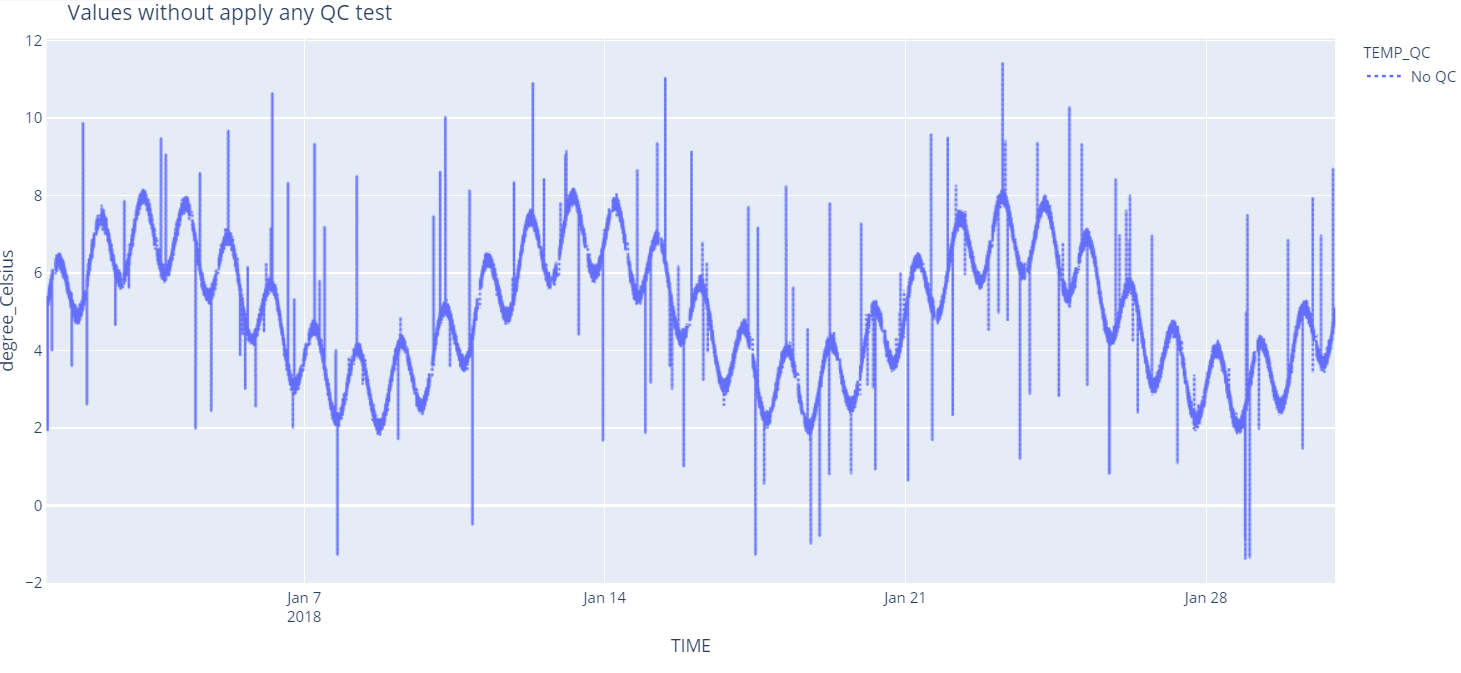
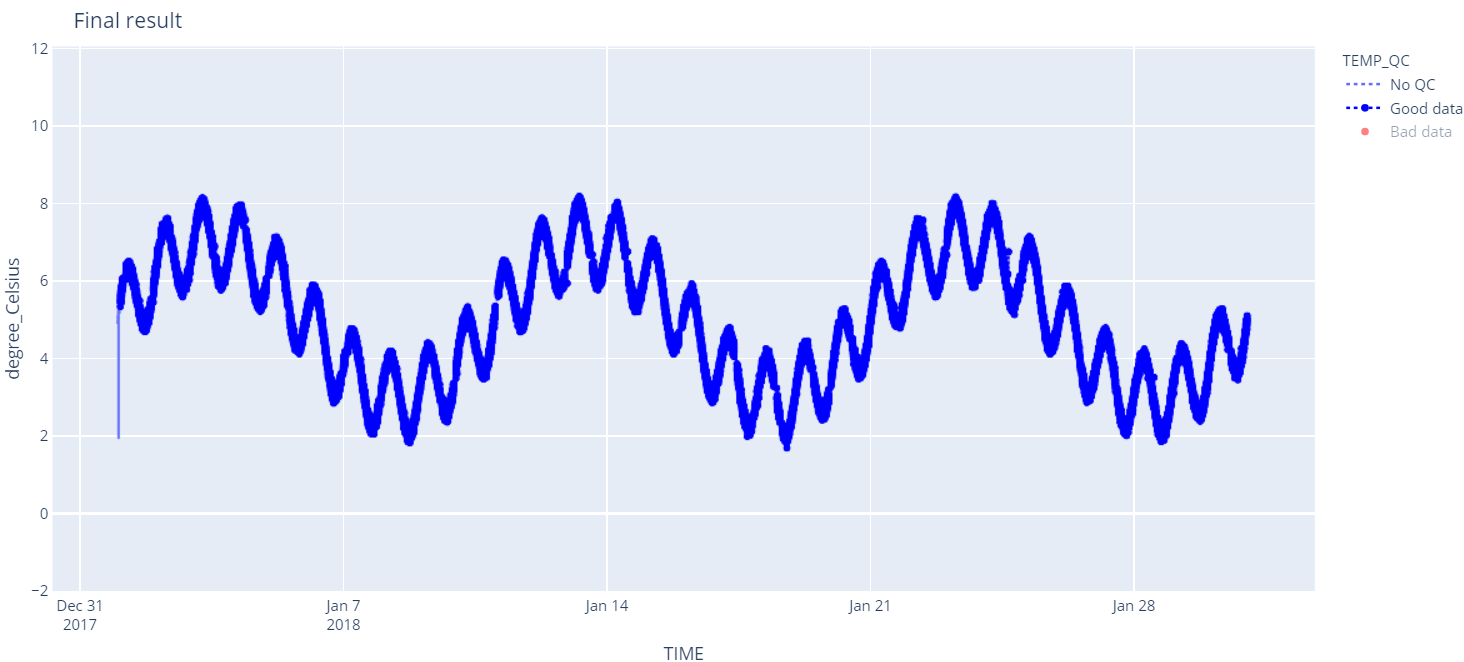
Finally, click on ‘Run Tests’. The execution of the tests take a while. At the end of each test, the widget shows a graph with the result.
The graphics are interactive. To view the bad data, click the option in the graph legend.
gui = md.widget_qc(wf, 'TEMP', range_test=[0, 50])
gui


Return to the Index of examples.