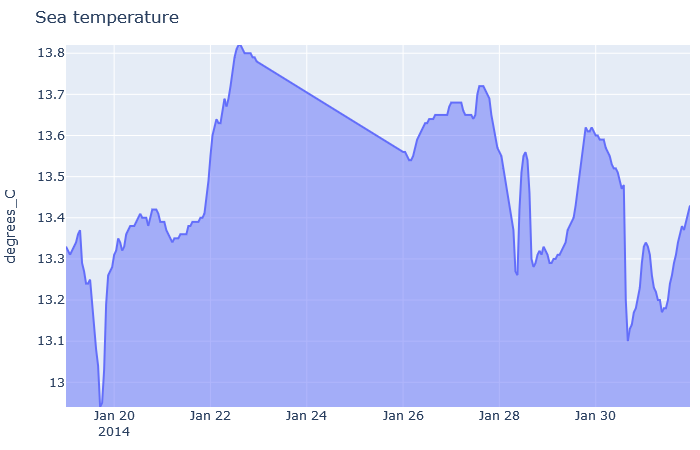
mooda.iplot_timeseries(list_wf, parameter_to_plot)
Reference
It creates a Plotly figure with the time-series of the input parameter.
Parameters
- list_wf: List of WaterFrames to be concatenated. (List of WaterFrames)
- parameter_to_plot: Parameters to plot. (str)
Returns
- figure: Dictionary of Plotly figure. (dict)
Example
To reproduce the example, download the NetCDF files MO_TS_MO_OBSEA_201401.nc and MO_TS_MO_OBSEA_201402.nc.
import mooda as md
import plotly.graph_objects as go

path = "MO_TS_MO_OBSEA_201401.nc"

wf = md.read_nc_emodnet(path)
list_wf = [wf]

fig = md.iplot_timeseries(list_wf, 'TEMP')
go.Figure(fig).show()
Output:

Note: This image is NOT the real output. This image is the output, saved in PNG.
Return to mooda.WaterFrame.